

University of Michigan ranked best college in the U.S.
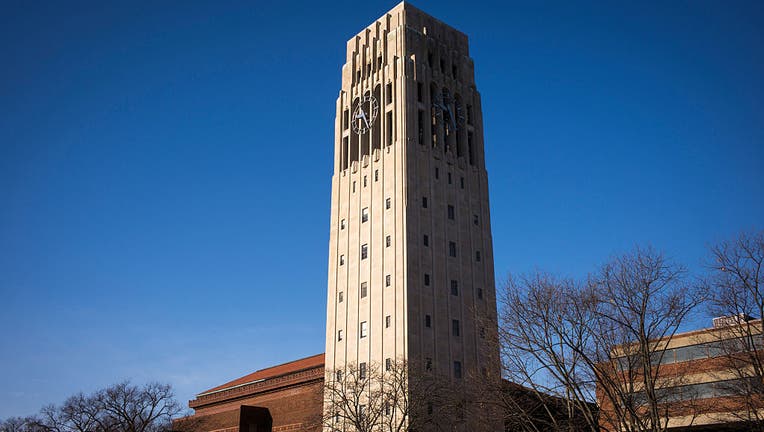
ANN ARBOR, MICHIGAN - MARCH 24: The Burton Memorial Tower stands on the central campus March 24, 2015 at the University of Michigan in Ann Arbor, Michigan. Built in 1936, the 120' tower is named for University President Marion Leroy Burton, who serve
SOUTHFIELD, Mich. (FOX 2) - The University of Michigan is one of the most prestigious public universities in the country and, according to Money.com, it's also the best college the country for its value.
Money ranked over 600 colleges based on multiple criteria including acceptance rate, full price tuition for 2022-223, tuition with average grant, the percentage of students who get those grants, the graduation rate, and the early career earnings. Michigan, with an overall score of 89.41, beat out the second place university by more than three points.
According to Money, Michigan has an acceptance rate of 26% and a graduation rate of 92%. The estimated cost of tuition is $32,400 for the next school year but grants bring that down to $18,800. More than half of the university's students get grants. Lastly, early career earnings are near $76,000.
Michigan, the state, was well-represented in the top 100 list with Michigan Tech in the Upper Peninsula ranking at number 61 and Michigan State at 65. UM-Dearborn was ranked at 227, Central Michigan is at 416, and Western Michigan came in at 523.
How is the value calculated?
Money listed its methodology, which started with four basic requirements of the college to even be evaluated:
- At least 500 undergraduate students
- Sufficient and reliable data available
- Not in financial distress
- Graduation rate at or above the median
The graduation rate is based on its category - like public, private, historically Black college or university - or have at least 25% of its undergrads graduate.
Students at Texas college graduate debt-free after anonymous donor pays off school loans
With those initial four requirements, Money took it further and measured each college with these factors:
Quality of education
This accounted for 30% of its score using multiple different factors.
First, the graduation rate within six years of admission. Next was the value-added rate, which is the difference between a school's graduation rate and its expected rate. Then peer quality was considered - which is measured by standardized test scores of freshman.
Instructor access was next - which is the student-to-faculty ratio - followed by Pell grant recipient outcomes, which is awarded to lower-income students.
Affordability
This might seem easy and it accounted for 40% of the score. Here's how it was calculated.
The first issue was the net price of the degree, what is the estimated amount a typical freshman starting in 2022 will pay to earn a degree. This takes into account how much is paid for the education and how long it takes to graduate.
The net price paid in different income brackets. This is a bit harder to understand but, effectively, it comes down to how much is paid by students from families earning less than $30K, how much is paid by families from $30K-$48K, and how much is paid by families earning $48K-$75K.
Debt is factored in as well, which takes into account the estimated average student debt on graduation and the average amount borrowed through the parent federal PLUS loan programs.
The ability to repay the debt was considered too, specifically in the first three years after school.
The last portion of affordability was the value-added student loan repayment measures, which is the school’s performance on the student loan repayment and default measures after adjusting for the economic and academic profile of the student body.
Outcomes
This one is going to be a bit complicated to understand but it all comes down to what is life like after college and it accounted for 30% of the score.
The first consideration was the earnings 10 years after college, which was from the U.S. Department of Education’s College Scorecard. The earnings are then adjusted for the majors, which takes a weighted average salary for each college.
The value added earnings was next, which was the 10 year earnings from the paragraph above but adjusted for economic and academic profile of the student.
Employment outcomes are factored in as well, with half of this score dependent upon enrolling in graduate school or working and the share of graduates who earn more than a high school degree after six years.
Mobility index was factored in, too, which measures the share of students from low to moderate incomes.
Lastly, the return on investment which measures the earnings after subtracting the cost of college.
Which schools weren't included?
Money separated the country's most selective schools, the colleges with acceptance rate was below 20% over the past three years. They're graded on the same scale but they're on their own llist.
Other schools not listed may not have had enough data. According to Money, this was largely due to graduation rate was too low. The median for public colleges was 56% graduation.